


Abstract
Saccharomyces cerevisiae cells (strain W303) grown in a minimal medium (containing 2% or 0.1% glucose) until exponential or stationary phase, were subjected to chronological aging in water, and yeast viability and nucleotide content were analyzed along several days of nutrient starvation. Cells collected in exponential phase (whether grown in the presence of 0.1% or 2% glucose) were viable up to five days and thereafter the viability decreased linearly with a half-survival rate of around eight days. ATP and other nucleoside triphosphates decreased similarly in both cases. Cells collected in stationary phase, and transferred to water, behaved differently whether grown in 0.1% or in 2% glucose, with a half-survival life of around nine and 28 days respectively. A double mutant in glycogen synthase (gsy1Δgsy2Δ) and its isogenic wild-type strain, grown to stationary phase in 2% glucose, presented a similar half-survival life of around eight days. The W303 cells grown to stationary phase in the presence of 2% glucose showed a 7-fold increase of UDP-N-acetylglucosamine (UDP-GlcNAc) as compared with the level present in the cells grown in any of the other three metabolic situations. The nature of UDP-GlcNAc was established by MALDI-TOF ionization analysis. It is also worth noting that the rate of decay of NAD+ was lower than that of ATP in any of the situations here considered.
1 Introduction
The budding yeast Saccharomyces cerevisiae has been taken as an experimental model to investigate senescence in eukaryotic cells [1–6]. Two major approaches have been used to determine life span in yeast: the replicative or budding life span, and the chronological aging or survival in stationary phase. In the replicative method the number of divisions of individual mother cells is followed in nutrient agar plates until they complete their cycle and arrest budding [1,2,7]. To study senescense with the chronological method, cells are grown until stationary phase and thereafter maintained for an additional period of time either in the same expired medium or in distilled water; viability can be determined along time of incubation by the ability of the remaining cells to form colonies on agar plates. With this procedure, but not with the replicative method, a sufficient number of cells can be obtained to perform classical biochemical studies [8,9].
Publications from Guarente's group [10–16] and from other investigators indicate that yeast aging has a strong genetic component [8,9,17]. The four silent information regulator (SIR) genes, coding for four proteins involved in silencing of transcription, promote longevity in S. cerevisiae. The silencing protein Sir2p is a chromatin-bound, NAD+-dependent histone deacetylase, which deacetylates lysines 9 and 14 of histone H3 and lysine 16 of histone H4 [14]. Sir2p by itself promotes longevity in yeast [12].
It has been observed using the replicative method that yeast cells growing in 0.5% glucose extended life span relative to those grown in 2% glucose [15–18]. At these two different glucose concentrations, yeast cells get their energy preferentially by respiration and fermentation, respectively [19]. The results [15–18] concerning extended yeast life span in oxidative/respiratory conditions (0.5% glucose) are in contrast with the suggestion that caloric restriction in mammals may reduce the levels of ROS (reactive-oxygen species) by retarding metabolism [3]. Although the ultimate causes of these life span variations are only partially known, it seems that the shunting of carbon metabolism toward the mitochondrial tricarboxylic-acid cycle plays a positive role in the prolongation of life span in yeast [15–18,20]. For this extension of life span, the occurrence of the SIR2 gene is required.
In the last few years we have gained some knowledge on the nucleotide content of yeast cells subjected to oxidative stress and on how the carbon source (glucose or glycerol) [21] or even different glucose concentrations in the medium (2% or 0.025%) [22] affect the response of S. cerevisiae to the oxidative injury promoted by H2O2. In the presence of 2% glucose, ATP and glyceraldehyde 3-phosphate dehydrogenase (GAPDH) decrease sharply in the first minutes of treatment with 1.5 mM H2O2, whereas in the presence of 0.025% glucose, the dehydrogenase decreases similarly, but the ATP level remains unchanged. As mentioned above, the growth of yeast at low or at high glucose concentration also affects the longevity of the cells [15–18,20].
Since there seems to be a common ground connecting senescence, generation of ROS, glucose metabolism and metabolic status of the yeast cells, as reflected by their nucleotide content, we here have tried to explore this relationship by measuring senescence and nucleotide level in four different experimental conditions: cells growing exponentially in 2% (Exp 2%) or 0.1% (Exp 0.1%) glucose and subjected to nutrient starvation in distilled water, and cells grown in 2% (Sta 2%) or 0.1% (Sta 0.1%) glucose to stationary phase and incubated in water. As shown below, differences in the life span and nucleotide content among the four groups of cells were observed. During this study an important increase in UDP-N-acetylglucosamine (UDP-GlcNAc) was observed in yeast cells grown in 2% glucose up to stationary phase (Sta 2%).
2 Materials and methods
2.1 Materials
Enzymes, cofactors and substrates were purchased from Sigma or Roche Molecular Biochemicals. Alkaline phosphatase (grade I, EC.3.1.3.1) was from Roche Molecular Biochemicals (Mannheim, Germany). UDP-glucose dehydrogenase, and UDP-derivatives used as standards were from Sigma (St Louis, MO, USA). Yeast nitrogen base (without amino acids and ammonium sulfate) was from Difco (Ref. 233520). Hypersil ODS (4.6 × 100 mm), Mono-Q HR 5/5 and Zorbax Sax (4.6 × 250 mm) columns were from Hewlett-Packard, Pharmacia and Agilent (Palo Alto, CA, USA), respectively.
2.2 Strain, medium, growth and starvation conditions
The strain used in this work was the wild-type W303-1A from S. cerevisiae, genotype: MAT leu2-3,112 his3-11,15 trp1-1 can1-100 ade2-1 ura3-1[23]. Cells were grown aerobically at 30 °C on a gyratory shaker (at 180 rpm), in a minimal medium containing (per liter): yeast nitrogen base (without amino acids and ammonium sulfate) 1.7 g; ammonium sulfate 5 g; glucose 20 or 1 g as indicated; leucine 0.08 g; tryptophan, adenine, histidine and uracil 0.04 g each. Growth was followed by monitoring the turbidity at 600 nm (A600= 1 corresponds to a concentration of around 1.5 × 10⁷ cells ml−1). Yeast cultures were inoculated at an initial concentration of 0.15 × 10⁷ cells ml−1; cells were harvested after 8 or 24 h incubation. In the first case the cells, at a density of 1.5 × 10⁷ cells ml−1, were in exponential phase of growth. In the second case (24 h incubation) the cell number reached a plateau value of around 4 × 10⁷ cells ml−1 or 13 × 107 cells ml−1, depending on the glucose concentration of the medium, 0.1% or 2%, respectively. These cells were in stationary (0.1%) or post-diauxic phase (2%) based on the following criteria, respectively: (i) absence of glucose and ethanol, or a concentration of less than 0.2% glucose and 0.6% ethanol in the medium; (ii) 10% budding in all the cultures examined; (iii) high resistance to lyticase treatment in both cases. To simplify the presentation of the results, the cells grown during 24 h in 0.1% or 2% glucose have been considered as stationary cells, although according to the above criteria cells grown in 2% glucose are in post-diauxic state. When indicated, some experiments were also performed with the strain JF1491 (a double mutant in glycogen synthase (gsy1Δgsy2Δ)) and its isogenic wild-type (kindly supplied by Dr. Jean François) [24]. In this case the cultures contained (per liter): yeast nitrogen base (without amino acids and ammonium sulfate) 1.7 g; ammonium sulfate 5 g; glucose 20 g, plus 0.04 g uracil in the case of the wild-type strain.
To study the effect of nutrient starvation, yeast cells (in exponential or stationary phase) were collected by centrifugation at 1700g for 5 min, washed twice and re-suspended in the same volume of sterile distilled water, and incubation with shaking continued for the time indicated. Cell viability was measured by plating serial dilutions of the yeast cultures on YPD plates (1% yeast extract, 2% peptone, 2% glucose) containing 2% agar, and counting the colonies formed after incubation at 30 °C for three days.
2.3 Extraction of nucleosides and nucleotides
The sampling method was essentially as described in [21]. In brief, 100 or 25-ml portions of the cell culture were rapidly collected by filtration and the yeast pellicle was immediately collected with the help of a spatula and immersed in liquid nitrogen. The samples were kept at −70 °C until extraction. To prepare the acidic extracts 1.2 mM HClO4 was added to the frozen yeast (0.4 ml per 100 mg wet weight) and the suspension was frozen and thawed three times to extract metabolites [25]. Cell debris was removed by centrifugation and the pellet re-extracted once with 0.2 mM HClO4 (0.1 ml per 100 mg wet weight). The supernatants were combined, neutralized with KOH/K2CO3 and analyzed by HPLC as previously described [26]. The intracellular concentration of the compounds studied was calculated assuming that 1 g of yeast (wet weight) contains 0.6 ml cell sap [27].
2.4 Energy charge
Energy charge is defined in terms of actual concentrations as ([ATP] + 0.5 [ADP])/([ATP] + [ADP] + [AMP]) [28].
2.5 Characterization of the nature of the UDP-sugars present in peak 2 of Fig. 2
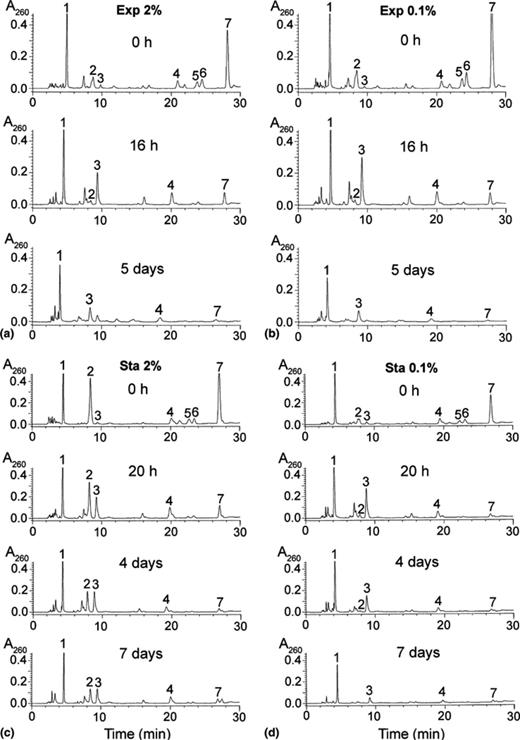
Chromatographic profiles of the nucleotide content of yeast cells subjected to starvation. Yeast cells were grown as described in Fig. 1. At the indicated times of incubation, aliquots were rapidly collected by filtration and the nucleotide content analyzed by HPLC as described in Section 2. The number on top of each chromatographic peak indicates the nature of the respective compounds: (1) NAD+; (2) UDP-sugars; (3) AMP; (4) ADP; (5) GTP; (6) UTP; (7) ATP.
Yeast cells were grown up to stationary phase in 2% glucose and the neutralized acidic extracts were prepared as above. An aliquot of the neutralized extract was treated with alkaline phosphatase to hydrolyze nucleoside mono-, di- and triphosphates, analyzed by borate high-performance liquid chromatography using a Zorbax Sax column equilibrated in 0.37 M boric acid, 0.15 M disodium tetraborate, and 2.0 M glycerol, pH 6.45. Nucleoside and UDP-sugars were eluted isocratically with the same buffer at a flow rate of 1 ml min−1, essentially as described in [29]. Standards of UDP-glucose, UDP-galactose, UDP-N-acetylglucosamine (UDP-GlcNAc), UDP-N-acetylgalactosamine and UDP-glucuronic acid were run in parallel. The content of UDP-glucose in the neutralized extracts was determined as described in [30] using UDP-glucose dehydrogenase.
2.6 Glycogen determination
The cell cultures were collected as described above. Glycogen was extracted and measured essentially as described in [31], except that the overnight incubation in the presence of amyloglucosidase, at pH 4.8, was performed at 55 °C as recommended by the manufacturer (Sigma). Liberated glucose was determined with the hexokinase/glucose-6-phosphate dehydrogenase system [32].
2.7 Preparation of samples for MALDI-TOF MS analysis
An aliquot of the neutralized extract, treated with alkaline phosphatase as above, was applied onto a Mono Q column equilibrated with 2 mM NH4HCO3, pH 7.7. The column was eluted at a flow rate of 1 ml min−1, with equilibration buffer for 5 min, followed by a 40-min linear gradient from 2 to 500 mM NH4HCO3. Fractions containing the UDP-sugar were collected (retention time (tR) = 16–17 min). Standards of UDP-glucose (tR= 18 min) and UDP-N-acetylglucosamine (tR= 16.6 min), were chromatographed and collected in the same way. Without further treatment, negative-ion spectra were recorded for each sample using a MALDI-TOF mass spectrometer (REFLEX III, Bruker, Billerica, MA, USA) equipped with a reflectron and nitrogen laser. The acceleration voltage was set at 20 kV. All experiments were carried out in the delayed extraction mode, allowing the determination of monoisotopic mass values (m/z; mass-to-charge ratio). Analyses were performed using 2′,4′,6′-trihydroxyacetophenone as matrix.
3 Results
3.1 Viability and nucleotide content of exponentially-growing yeast cells subjected to chronological aging
Yeast cells grown exponentially in a minimal medium (containing 2% or 0.1% glucose) until a density of A600= 1(1.5 × 10⁷ cells ml−1), were collected by centrifugation, re-suspended in sterile distilled water and the incubation continued (see Section 2). Yeast viability and nucleotide content were analyzed in aliquots taken, at the indicated times, along nine days of incubation (Fig. 1(a) and (b) and Tables 1 and 2). In both experimental conditions (Exp 2% or Exp 0.1%) cells were viable for a period of five days and thereafter the viability decreased linearly with a half-survival rate of around eight days (Fig. 1(a) and (b)). The content of ATP and that of other nucleoside triphosphates (NTPs) decreased similarly in both cases. In general NTPs decreased around 30%, 80% and 90% after 2, 16 and 40 h incubation in water, respectively (Tables 1 and 2). As expected, the amount of nucleoside mono-(NMPs) and diphosphates (NDPs) increased after 2, 16 or 40 h of incubation, to finally decrease at longer times of starvation in water (Tables 1 and 2). It is significant that the level of NAD+ decreased only around 20% after 40 h incubation in water, whereas at that time the decrease in ATP was around 90% (Fig. 1(a) and (b) and Tables 1 and 2). This fact is well reflected by the ratios NAD+/ATP along the time of incubation in water. In the experiments corresponding to Exp 2% or Exp 0.1% those ratios, in parenthesis, were, respectively: 0 h (0.7, 0.6); 2 h (1.1, 1.1); 16 h (4.5, 3.7); 40 h (5.5, 5.6). In both conditions, after five days of incubation in distilled water the concentrations of both NAD+ and ΣATP + ADP + AMP (ΣA) were around 0.32 mM, and the viability of the yeast cells started to decrease linearly from then on. The data presented in Tables 1 and 2 represent mean values of three to six independent determinations. Representative profiles of HPLC chromatograms from samples of the experiments Exp 2% or Exp 0.1%, taken at 0 h, 16 h and five days of culture in water are presented in Fig. 2(a) and (b), respectively.
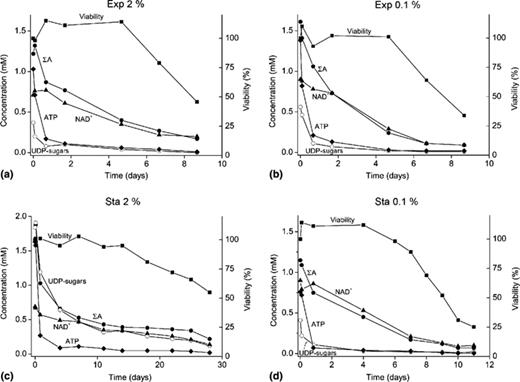
Viability, ATP, NAD+, UDP-sugars and ΣAMP + ADP + ATP content of yeast cells subjected to starvation. S. cerevisiae grown exponentially in a minimal medium containing 2% (a) or 0.1% (b) glucose up to a density of 1.5 × 10⁷ cells ml−1, were collected by centrifugation and transferred to water. At the indicated times of incubation, aliquots were taken and the survival and nucleotide content determined (see Section 2). In (c) and (d) cells were grown up to stationary phase in 2% or 0.1% glucose up to a density of 13 × 07 or 4 × 10⁷ cells ml−1, respectively, collected and transferred to water. At the indicated times of incubation, cell survival and nucleotide content was determined as above. ΣA = ATP + ADP + AMP.
Nucleotide content and viability of Saccharomyces cerevisiae (strain W303) grown to exponential phase in the presence of 2% glucose and subjected to chronological aging in water
| Time, hours (days) | |||||||
| 0 | 2 | 16 | 40 | (5) | (7) | (9) | |
| AMP | 0.06 ± 0.03 | 0.29 ± 0.08 | 0.48 ± 0.05 | 0.48 ± 0.08 | 0.23 ± 0.02 | 0.14 ± 0.01 | 0.07 ± 0.00 |
| ADP | 0.20 ± 0.05 | 0.32 ± 0.05 | 0.21 ± 0.01 | 0.19 ± 0.01 | 0.11 ± 0.00 | 0.08 ± 0.01 | 0.06 ± 0.01 |
| ATP | 1.03 ± 0.14 | 0.71 ± 0.22 | 0.17 ± 0.02 | 0.11 ± 0.02 | 0.06 ± 0.00 | 0.04 ± 0.00 | 0.01 ± 0.00 |
| Σ (ATP + ADP + AMP) | 1.29±0.18 | 1.32±0.17 | 0.87±0.02 | 0.77±0.09 | 0.40±0.02 | 0.26±0.02 | 0.14±0.01 |
| Adenylic charge | 0.87 ± 0.03 | 0.65 ± 0.10 | 0.32 ± 0.03 | 0.26 ± 0.03 | 0.28 ± 0.01 | 0.30 ± 0.01 | 0.28 ± 0.01 |
| CMP | 0.02 ± 0.01 | 0.08 ± 0.00 | 0.08 ± 0.00 | 0.05 ± 0.02 | 0.06 ± 0.00 | 0.04 ± 0.00 | |
| CDP | 0.01 ± 0.00 | 0.03 ± 0.01 | 0.01 ± 0.00 | <0.01 | <0.01 | <0.01 | |
| CTP | 0.15 ± 0.03 | 0.09 ± 0.02 | <0.01 | <0.01 | <0.01 | <0.01 | |
| Σ (CTP + CDP + CMP) | 0.18±0.04 | 0.21±0.02 | 0.09±0.01 | 0.05±0.02 | 0.06±0.00 | 0.04±0.00 | <0.01 |
| GMP | 0.01 ± 0.00 | 0.06 ± 0.00 | 0.08 ± 0.00 | 0.11 ± 0.01 | 0.06 ± 0.00 | 0.04 ± 0.00 | |
| GDP | 0.04 ± 0.01 | 0.06 ± 0.01 | 0.05 ± 0.00 | 0.06 ± 0.00 | 0.03 ± 0.00 | 0.01 ± 0.00 | |
| GTP | 0.17 ± 0.04 | 0.12 ± 0.00 | 0.02 ± 0.00 | 0.03 ± 0.01 | 0.02 ± 0.00 | 0.01 ± 0.00 | |
| Σ (GTP + GDP + GMP) | 0.21±0.05 | 0.24±0.01 | 0.15±0.01 | 0.19±0.02 | 0.11±0.00 | 0.06±0.00 | <0.01 |
| UMP | 0.01 ± 0.00 | 0.18 ± 0.05 | 0.25 ± 0.01 | 0.29 ± 0.05 | 0.10 ± 0.00 | 0.05 ± 0.00 | |
| UDP | 0.07 ± 0.02 | 0.12 ± 0.03 | 0.10 ± 0.00 | 0.11 ± 0.01 | 0.05 ± 0.00 | 0.03 ± 0.00 | |
| UTP | 0.32 ± 0.07 | 0.33 ± 0.02 | 0.09 ± 0.01 | 0.05 ± 0.02 | 0.03 ± 0.00 | 0.03 ± 0.01 | |
| Σ (UTP + UDP + UMP) | 0.40±0.08 | 0.61±0.04 | 0.44±0.01 | 0.45±0.06 | 0.18±0.01 | 0.11±0.01 | <0.01 |
| NAD+ | 0.74 ± 0.07 | 0.76 ± 0.07 | 0.77 ± 0.08 | 0.61 ± 0.07 | 0.35 ± 0.03 | 0.21 ± 0.01 | 0.20 ± 0.01 |
| UDP-sugar | 0.37 ± 0.10 | 0.20 ± 0.11 | 0.08 ± 0.00 | 0.10 ± 0.02 | 0.04 ± 0.01 | 0.02 ± 0.01 | 0.02 ± 0.01 |
| Viability (%) | 100 | 98 ± 2 | 115 ± 24 | 111 ± 3 | 114 ± 4 | 79 ± 8 | 45 ± 7 |
Analysis of nucleotide content was performed as described in Section 2. The data represent mean values of ±SE of three to six experiments.
The concentrations of the indicated compounds are expressed in mM.
Nucleotide content and viability of Saccharomyces cerevisiae (strain W303) grown to exponential phase in the presence of 2% glucose and subjected to chronological aging in water
| Time, hours (days) | |||||||
| 0 | 2 | 16 | 40 | (5) | (7) | (9) | |
| AMP | 0.04 ± 0.01 | 0.23 ± 0.03 | 0.62 ± 0.02 | 0.40 ± 0.12 | 0.15 ± 0.05 | 0.06 ± 0.03 | 0.04 ± 0.01 |
| ADP | 0.18 ± 0.03 | 0.36 ± 0.02 | 0.26 ± 0.02 | 0.19 ± 0.04 | 0.06 ± 0.02 | 0.03 ± 0.01 | 0.03 ± 0.00 |
| ATP | 1.38 ± 0.12 | 0.82 ± 0.08 | 0.21 ± 0.04 | 0.13 ± 0.04 | 0.03 ± 0.00 | 0.02 ± 0.00 | 0.02 ± 0.01 |
| Σ (ATP + ADP + AMP) | 1.61±0.10 | 1.41±0.07 | 1.06±0.05 | 0.73±0.20 | 0.24±0.07 | 0.11±0.03 | 0.09±0.02 |
| Adenylic charge | 0.92 ± 0.02 | 0.70 ± 0.03 | 0.31 ± 0.02 | 0.34 ± 0.04 | 0.26 ± 0.02 | 0.34 ± 0.10 | 0.32 ± 0.02 |
| CMP | 0.04 ± 0.02 | 0.10 ± 0.01 | 0.07 ± 0.01 | 0.07 ± 0.02 | 0.03 ± 0.01 | 0.01 ± 0.00 | |
| CDP | 0.01 ± 0.00 | 0.03 ± 0.00 | <0.01 | <0.01 | <0.01 | <0.01 | |
| CTP | 0.21 ± 0.07 | 0.10 ± 0.01 | <0.01 | <0.01 | <0.01 | <0.01 | |
| Σ (CTP + CDP + CMP) | 0.26±0.04 | 0.23±0.01 | 0.07±0.01 | 0.07±0.02 | 0.03±0.01 | 0.01±0.00 | <0.01 |
| GMP | <0.01 | 0.03 ± 0.00 | 0.11 ± 0.01 | 0.10 ± 0.03 | 0.03 ± 0.01 | 0.01 ± 0.00 | |
| GDP | 0.03 ± 0.01 | 0.05 ± 0.00 | 0.06 ± 0.00 | 0.05 ± 0.01 | 0.01 ± 0.00 | <0.01 | |
| GTP | 0.22 ± 0.04 | 0.12 ± 0.00 | 0.03 ± 0.00 | 0.03 ± 0.01 | <0.01 | <0.01 | |
| Σ (GTP + GDP + GMP) | 0.25±0.04 | 0.21±0.00 | 0.20±0.01 | 0.18±0.06 | 0.04±0.01 | 0.01±0.00 | <0.01 |
| UMP | <0.01 | 0.14 ± 0.01 | 0.31 ± 0.02 | 0.22 ± 0.07 | 0.04 ± 0.01 | 0.01 ± 0.00 | |
| UDP | 0.06 ± 0.01 | 0.10 ± 0.01 | 0.13 ± 0.01 | 0.09 ± 0.03 | 0.02 ± 0.00 | 0.01 ± 0.00 | |
| UTP | 0.44 ± 0.09 | 0.32 ± 0.01 | 0.09 ± 0.00 | 0.07 ± 0.03 | 0.01 ± 0.00 | <0.01 | |
| Σ (UMP + UDP + UTP) | 0.51±0.09 | 0.56±0.02 | 0.53±0.02 | 0.38±0.12 | 0.08±0.02 | 0.02±0.01 | <0.01 |
| NAD+ | 0.90 ± 0.07 | 0.88 ± 12 | 0.78 ± 0.10 | 0.73 ± 0.10 | 0.29 ± 0.06 | 0.11 ± 0.04 | 0.09 ± 0.02 |
| UDP-sugar | 0.56 ± 0.02 | 0.46 ± 0.12 | 0.11 ± 0.01 | 0.07 ± 0.02 | 0.02 ± 0.00 | <0.01 | <0.01 |
| Viability (%) | 100 | 110 ± 39 | 93 ± 2 | 102 ± 31 | 101 ± 22 | 64 ± 14 | 34 ± 7 |
Analysis of nucleotide content was performed as described in Section 2.
The data represent mean values of ±SE of three to six experiments.
The concentrations of the indicated compounds are expressed in mM.
3.2 Viability and nucleotide content of stationary yeast cells subjected to chronological aging
The experimental approach was similar as above, except that yeast cells were grown up to stationary phase in 2% or 0.1% glucose reaching a density of 13 × 107 or 4 × 10⁷ cells ml−1, respectively (Fig. 1(c) and (d) and Tables 3 and 4; note the different time scale in (c)). Cells were collected by centrifugation, re-suspended in distilled water and incubated further. The viability and nucleotide content were determined in aliquots taken at the indicated times (Fig. 1 (c) and (d)). In the case of cells grown in 2% glucose, the viability was maintained up to 14 days with a half-life of around 28 days. The viability of the cells grown in 0.1% glucose was much lower with a survival of around six days in water, and a half-life of around nine days. Concerning nucleotide levels before nutrient starvation, cells grown in 0.1% glucose showed lower levels of NTPs compared with those grown in 2% glucose, i.e. around 50%, 30%, and 20% less ATP, GTP and UTP, respectively (Fig. 1(c) and (d) and Tables 3 and 4); however, the concentration of NAD+ was higher in cells grown in 0.1% glucose as compared with those grown in 2% glucose (Tables 3 and 4), whereas the concentration of the ΣA was significantly lower.
Nucleotide content and viability of Saccharomyces cerevisiae (strain W303) grown to stationary phase (see Section 2) in the presence of 2% glucose and subjected to chronological aging in water
| Time, hours (days) | |||||||||||
| 0 | 2 | 20 | (4) | (7) | (11) | (14) | (18) | (22) | (25) | (28) | |
| AMP | 0.04 ± 0.02 | 0.11 ± 0.02 | 0.48 ± 0.11 | 0.40 ± 0.02 | 0.29 ± 0.03 | 0.22 ± 0.01 | 0.23 ± 0.02 | 0.23 ± 0.01 | 0.22 ± 0.01 | 0.21 ± 0.02 | 0.13 ± 0.01 |
| ADP | 0.17 ± 0.03 | 0.20 ± 0.02 | 0.27 ± 0.02 | 0.18 ± 0.01 | 0.13 ± 0.01 | 0.12 ± 0.01 | 0.10 ± 0.01 | 0.10 ± 0.01 | 0.09 ± 0.01 | 0.08 ± 0.01 | 0.06 ± 0.01 |
| ATP | 1.63 ± 0.18 | 1.58 ± 0.02 | 0.27 ± 0.03 | 0.09 ± 0.00 | 0.11 ± 0.01 | 0.08 ± 0.02 | 0.05 ± 0.01 | 0.05 ± 0.01 | 0.05 ± 0.00 | 0.04 ± 0.01 | 0.02 ± 0.00 |
| Σ (ATP + ADP + AMP) | 1.84±0.18 | 1.88±0.07 | 1.03±0.15 | 0.66±0.03 | 0.53±0.03 | 0.43±0.03 | 0.39±0.04 | 0.38±0.01 | 0.36±0.01 | 0.34±0.02 | 0.22±0.02 |
| Adenylic charge | 0.93 ± 0.01 | 0.88 ± 0.01 | 0.41 ± 0.05 | 0.27 ± 0.01 | 0.32 ± 0.02 | 0.34 ± 0.03 | 0.27 ± 0.02 | 0.27 ± 0.01 | 0.26 ± 0.00 | 0.25 ± 0.00 | 0.25 ± 0.01 |
| CMP | 0.03 ± 0.01 | 0.03 ± 0.01 | 0.05 ± 0.01 | 0.06 ± 0.01 | 0.06 ± 0.01 | 0.05 ± 0.01 | 0.06 ± 0.01 | 0.05 ± 0.01 | 0.05 ± 0.01 | 0.03 ± 0.00 | 0.02 ± 0.00 |
| CDP | 0.01 ± 0.00 | 0.02 ± 0.01 | 0.02 ± 0.00 | <0.01 | <0.01 | <0.01 | <0.01 | <0.01 | <0.01 | <0.01 | <0.01 |
| CTP | 0.20 ± 0.03 | 0.27 ± 0.01 | 0.01 ± 0.00 | <0.01 | <0.01 | <0.01 | <0.01 | <0.01 | <0.01 | <0.01 | <0.01 |
| Σ (CTP + CDP + CMP) | 0.24±0.03 | 0.32±0.01 | 0.07±0.01 | 0.06±0.01 | 0.06±0.01 | 0.05±0.01 | 0.06±0.01 | 0.05±0.01 | 0.05±0.01 | 0.03±0.00 | 0.02±0.00 |
| GMP | 0.01 ± 0.00 | 0.01 ± 0.00 | 0.08 ± 0.02 | 0.09 ± 0.01 | 0.05 ± 0.01 | 0.04 ± 0.01 | 0.06 ± 0.01 | 0.06 ± 0.01 | 0.05 ± 0.01 | 0.05 ± 0.01 | 0.03 ± 0.00 |
| GDP | 0.02 ± 0.01 | 0.03 ± 0.00 | 0.06 ± 0.01 | 0.04 ± 0.01 | 0.03 ± 0.00 | 0.03 ± 0.00 | 0.02 ± 0.00 | 0.02 ± 0.01 | 0.02 ± 0.01 | 0.01 ± 0.00 | <0.01 |
| GTP | 0.20 ± 0.02 | 0.19 ± 0.02 | 0.04 ± 0.01 | 0.01 ± 0.00 | 0.02 ± 0.00 | 0.02 ± 0.00 | 0.01 ± 0.00 | 0.01 ± 0.00 | 0.01 ± 0.00 | 0.01 ± 0.00 | <0.01 |
| Σ(GTP + GDP + GMP) | 0.23±0.02 | 0.23±0.02 | 0.18±0.03 | 0.14±0.01 | 0.10±0.01 | 0.09±0.01 | 0.09±0.01 | 0.09±0.01 | 0.08±0.01 | 0.07±0.01 | 0.04±0.01 |
| UMP | 0.07 ± 0.01 | 0.12 ± 0.01 | 0.22 ± 0.05 | 0.26 ± 0.02 | 0.16 ± 0.02 | 0.12 ± 0.01 | 0.12 ± 0.02 | 0.12 ± 0.01 | 0.09 ± 0.01 | 0.09 ± 0.01 | 0.05 ± 0.01 |
| UDP | 0.03 ± 0.01 | 0.05 ± 0.01 | 0.11 ± 0.02 | 0.08 ± 0.00 | 0.05 ± 0.01 | 0.05 ± 0.01 | 0.04 ± 0.00 | 0.04 ± 0.01 | 0.02 ± 0.01 | 0.02 ± 0.01 | 0.02 ± 0.01 |
| UTP | 0.24 ± 0.02 | 0.31 ± 0.02 | 0.08 ± 0.01 | 0.04 ± 0.00 | 0.04 ± 0.01 | 0.03 ± 0.01 | 0.02 ± 0.01 | 0.02 ± 0.00 | 0.02 ± 0.00 | 0.02 ± 0.00 | <0.01 |
| Σ(UTP + UDP + UMP) | 0.34±0.04 | 0.49±0.04 | 0.41±0.06 | 0.37±0.02 | 0.26±0.03 | 0.21±0.02 | 0.19±0.03 | 0.18±0.02 | 0.13±0.01 | 0.13±0.00 | 0.07±0.01 |
| NAD+ | 0.69 ± 0.03 | 0.67 ± 0.05 | 0.57 ± 0.10 | 0.49 ± 0.02 | 0.47 ± 0.04 | 0.35 ± 0.02 | 0.34 ± 0.01 | 0.30 ± 0.02 | 0.26 ± 0.01 | 0.21 ± 0.01 | 0.14 ± 0.01 |
| UDP-sugars | 1.84 ± 0.09 | 1.91 ± 0.14 | 1.19 ± 0.20 | 0.64 ± 0.02 | 0.47 ± 0.02 | 0.32 ± 0.02 | 0.34 ± 0.02 | 0.26 ± 0.01 | 0.22 ± 0.01 | 0.20 ± 0.01 | 0.12 ± 0.01 |
| Viability (%) | 100 | 101 ± 7 | 101 ± 15 | 95 ± 7 | 103 ± 8 | 94 ± 7 | 95 ± 11 | 81 ± 2 | 72 ± 8 | 66 ± 4 | 55 ± 4 |
Analysis of nucleotide content was performed as described in Section 2. The data represent mean values of ±SE of three to six experiments.
The concentrations of the indicated compounds are expressed in mM.
Nucleotide content and viability of Saccharomyces cerevisiae (strain W303) grown to stationary phase (see Section 2) in the presence of 0.1% glucose and subjected to chronological aging in water
| Time, hours (days) | ||||||||
| 0 | 2 | 20 | (4) | (7) | (9) | (10) | (11) | |
| AMP | 0.14 ± 0.01 | 0.12 ± 0.01 | 0.51 ± 0.01 | 0.31 ± 0.03 | 0.12 ± 0.01 | 0.07 ± 0.01 | 0.05 ± 0.01 | 0.05 ± 0.01 |
| ADP | 0.25 ± 0.02 | 0.25 ± 0.03 | 0.17 ± 0.03 | 0.10 ± 0.02 | 0.03 ± 0.00 | 0.04 ± 0.01 | 0.02 ± 0.01 | 0.02 ± 0.01 |
| ATP | 0.76 ± 0.10 | 0.72 ± 0.02 | 0.07 ± 0.01 | 0.04 ± 0.01 | 0.02 ± 0.00 | 0.01 ± 0.00 | <0.01 | <0.01 |
| Σ (ATP + ADP + AMP) | 1.15±0.10 | 1.09±0.05 | 0.75±0.03 | 0.45±0.04 | 0.17±0.02 | 0.12±0.01 | 0.07±0.02 | 0.07±0.01 |
| Adenylic charge | 0.76 ± 0.03 | 0.77 ± 0.01 | 0.20 ± 0.01 | 0.20 ± 0.01 | 0.20 ± 0.01 | 0.24 ± 0.02 | 0.18 ± 0.02 | 0.17 ± 0.01 |
| CMP | 0.06 ± 0.01 | 0.06 ± 0.01 | 0.05 ± 0.02 | 0.04 ± 0.00 | 0.02 ± 0.00 | 0.03 ± 0.01 | 0.02 ± 0.00 | 0.02 ± 0.01 |
| CDP | 0.01 ± 0.00 | 0.01 ± 0.00 | <0.01 | <0.01 | <0.01 | <0.01 | <0.01 | <0.01 |
| CTP | 0.08 ± 0.01 | 0.10 ± 0.01 | <0.01 | <0.01 | <0.01 | <0.01 | <0.01 | <0.01 |
| Σ (CTP + CDP + CMP) | 0.15±0.02 | 0.17±0.01 | 0.05±0.02 | 0.04±0.00 | 0.02±0.00 | 0.03±0.01 | 0.02±0.00 | 0.02±0.01 |
| GMP | 0.03 ± 0.00 | 0.03 ± 0.00 | 0.16 ± 0.01 | 0.08 ± 0.01 | 0.02 ± 0.00 | 0.02 ± 0.01 | 0.01 ± 0.00 | 0.01 ± 0.00 |
| GDP | 0.04 ± 0.00 | 0.03 ± 0.00 | 0.04 ± 0.01 | 0.02 ± 0.00 | <0.01 | <0.01 | <0.01 | <0.01 |
| GTP | 0.14 ± 0.01 | 0.12 ± 0.01 | 0.01 ± 0.00 | 0.01 ± 0.00 | <0.01 | <0.01 | <0.01 | <0.01 |
| Σ (GTP + GDP + GMP) | 0.21±0.01 | 0.18±0.01 | 0.21±0.02 | 0.11±0.02 | 0.02±0.00 | 0.03±0.01 | 0.01±0.00 | 0.02±0.01 |
| UMP | 0.07 ± 0.01 | 0.07 ± 0.01 | 0.27 ± 0.03 | 0.10 ± 0.04 | 0.03 ± 0.01 | 0.02 ± 0.01 | 0.02 ± 0.01 | 0.02 ± 0.01 |
| UDP | 0.08 ± 0.01 | 0.06 ± 0.01 | 0.08 ± 0.01 | 0.03 ± 0.01 | <0.01 | <0.01 | <0.01 | <0.01 |
| UTP | 0.19 ± 0.01 | 0.25 ± 0.01 | 0.03 ± 0.01 | 0.02 ± 0.00 | <0.01 | <0.01 | <0.01 | <0.01 |
| Σ (UTP + UDP + UMP) | 0.34±0.02 | 0.38±0.02 | 0.38±0.04 | 0.15±0.05 | 0.03±0.01 | 0.03±0.01 | 0.02±0.01 | 0.02±0.01 |
| NAD+ | 0.90 ± 0.05 | 0.79 ± 0.03 | 0.86 ± 0.07 | 0.53 ± 0.03 | 0.21 ± 0.01 | 0.13 ± 0.01 | 0.09 ± 0.02 | 0.10 ± 0.02 |
| UDP-sugars | 0.41 ± 0.03 | 0.22 ± 0.02 | 0.11 ± 0.02 | 0.03 ± 0.01 | 0.02 ± 0.00 | 0.02 ± 0.01 | 0.01 ± 0.00 | 0.02 ± 0.01 |
| Viability (%) | 100 | 114 ± 13 | 111 ± 11 | 112 ± 11 | 89 ± 11 | 52 ± 3 | 31 ± 3 | 25 ± 3 |
Analysis of nucleotide content was performed as described in Section 2. The data represent mean values of ±SE of three to six experiments.
The concentrations of the indicated compounds are expressed in mM.
With a particular exception, the nucleotide content of the cells previously grown in 2% glucose followed the expected pattern: the NTPs decreased during incubation in water, whereas NDPs and particularly NMPs increased after 2 and 20 h, followed by a general decrease of the nucleotide content; in contrast, the decrease of the NAD+ level was evident only after four days of incubation. The above-mentioned exception refers to the unexpected size of a chromatographic peak migrating in the position of the UDP-sugars (peak 2 in Fig. 2(c) and Tables 3 and 4). The composition of this peak was analyzed as follows.
3.3 High content of UDP-N-acetylglucosamine (UDP-GlcNAc) in yeast cells grown to stationary phase in 2% glucose
As appreciated in Fig. 2(c), and comparing Tables 1 and 3, a significant increase in the chromatographic peak (peak 2) corresponding to potential UDP-sugar(s) was observed in yeast cells grown to stationary phase in the presence of 2% glucose (Sta 2%). This peak decreased during the incubation in distilled water (peak 2 in Fig. 2(c) and Table 3), reaching after seven days of starvation a value similar to that present in the group of cells grown up to stationary phase in the presence of 0.1% glucose (Fig. 2(d) and Table 4). In order to analyze the nature of the UDP-sugar(s) present under this chromatographic peak the following experiments were conducted:
(i) Neutralized HClO4 extracts from Sta 2% cells were analyzed to determine the amount of UDP-glucose present, using UDP-glucose dehydrogenase as auxiliary enzyme and NAD+ as cofactor [30]. Before starvation in water (0 h), UDP-glucose amounted only to around 20% of the potential UDP-sugar(s) present in peak 2 (Fig. 2(c)).
(ii) The same neutralized extract, treated with alkaline phosphatase (to dephosphorylate nucleotides), applied to a Zorbax Sax column, and eluted as described in Section 2, yielded a major chromatographic peak eluting at around 6.8 min with an ultraviolet spectrum similar to that of UDP. The following markers, applied successively under the same experimental conditions, eluted at the indicated times (min): adenosine (3.9); UDP-N-acetylglucosamine and NAD+ (6.8); UDP-glucose (7.2); UDP-N-acetylgalactosamine (8.4); UDP-galactose (9.1), and UDP-glucuronic acid (18.9). These results strongly pointed to UDP-GlcNAc as the main component of the chromatographic peak corresponding to UDP-sugar(s) present in the cells grown to stationary phase in 2% glucose (Fig. 2(c), peak 2).
(iii) A standard of UDP-GlcNAc co-eluted in the same position of the compound(s) under peak 2 in two other different chromatographic conditions: using a Hypersyl ODS column (as in Fig. 2) or a Mono Q column (results not shown).
(iv) Although the above results strongly pointed to UDP-GlcNAc as the main component of the UDP-sugar(s) present in yeast cells grown to stationary phase in the presence of 2% glucose (Fig. 2(c), peak 2), further characterization was carried out using the MALDI-TOF ionization technique. The presumptive UDP-GlcNAc was obtained from a neutralized extract of Sta 2% cells treated with alkaline phosphatase, and purified by chromatography on a Mono Q column as described in Section 2. Standards of UDP-glucose and UDP-GlcNAc were submitted to the same treatment and analyzed in parallel. The MALDI-TOF assays were carried out by detection of negative ions using 2,4,6-trihydroxyacetophenone as matrix. In the case of UDP-glucose (Fig. 3(c)) the following monocharged ions, with the indicated masses were observed: [M − H+]−, 565; [M + Na+− 2H+]−, 587; and [M + K+− 2H+]−, 603, all of them arising from the same neutral species [M] of a molecular mass of 566. When the standard of UDP-GlcNAc (Fig. 3(b)) was analyzed, the following negative ions were detected, coming all of them from the same neutral species [M] of a molecular mass of 607: [M − H+]−, 606; [M + Na+− 2H+]−, 628 and [M + K+− 2H+]−, 644. The spectrum of the unknown UDP-sugar (Fig. 3(a)) was practically identical to that of UDP-GlcNAc. Altogether, these results demonstrate that the cells grown to stationary phase in 2% glucose (Sta 2%) accumulate UDP-GlcNAc.
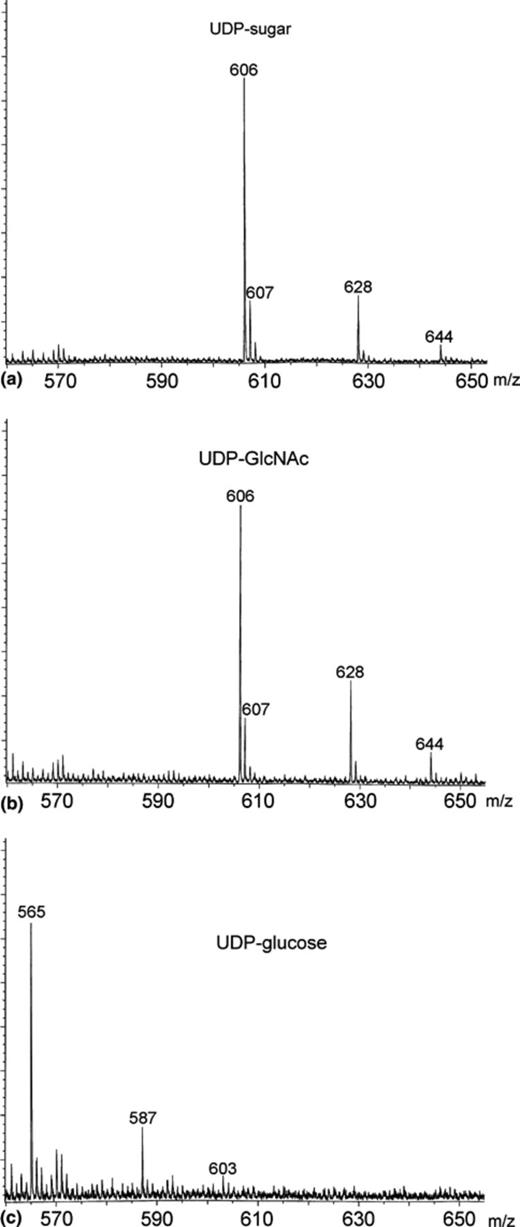
Characterization of UDP-GlcNAc by MALDI–TOF mass spectrometry. Mass- spectrometric determination of the molecular masses of the main component of peak 2 (Fig. 2(c), 0 h). An aliquot of the neutralized extract from Sta 2% cells before starvation was treated with alkaline phosphatase and applied onto a Mono Q column as described in Section 2. Fractions containing the UDP-sugar peak were collected (tR= 16–17 min), and without further treatment, negative-ion spectra were recorded using a MALDI-TOF mass spectrometer (a). Standards of UDP-GlcNAc and UDP-glucose, treated in the same way (see Section 2) were recorded in the mass spectrophotometer as shown in (b) and (c), respectively.
As deduced by comparing Tables 1 and 3 the peak corresponding to UDP-sugar(s), increases around 5-fold in stationary phase as compared with the level reached at the exponential phase of growth. In our experimental conditions the time elapsed between these two conditions was around 16–20 h. We analyzed the concentration of the peak corresponding to UDP-sugars and that of UDP-glucose from the start of the culture, at an A600 of 1.3 OD, until a density of 9.7 after 24 h incubation. As shown in Fig. 4, the total level of UDP-sugar(s) increased with the increase in A600 absorbance of the culture, whereas UDP-glucose and the adenine nucleotide pool reached a steady state after 5 h of incubation. By contrast the adenylic charge values (0.88 ± 0.02), the concentration (mM) of UTP (0.31 ± 0.04) and of NAD+ (0.54 ± 0.09) did not change significantly (not shown).
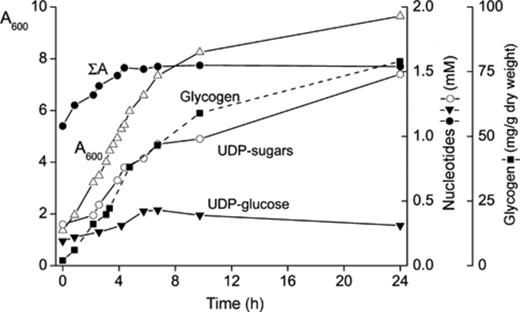
Increase of UDP-sugar(s) concentration in yeast along time of incubation in the presence of 2% glucose. Yeast cells were grown in a minimal medium containing 2% glucose until an optical density of 1.3 at A600 (0 h). The culture continued to grow in the same medium until a density at A600 of 9.7 (24 h). Aliquots were taken at several times of incubation to follow, by HPLC, the total content of UDP-sugar(s) and that of other nucleotides. UDP-glucose and glycogen were quantified enzymatically (see Section 2).
The unexpected increase in UDP-GlcNAc brought us to analyze the glycogen content in those cultures. As previously reported by others [33,34], the level of this carbohydrate increases steadily along the time of incubation, reaching a maximum in the post-diauxic phase (Fig. 4).
3.4 Cell viability and glycogen content
The potential relationship between cell viability and glycogen content was analyzed, in our working conditions, using the strain JF1491, a double mutant in glycogen synthase (gsy1Δgsy2Δ), and its isogenic wild-type [24]. Both strains were grown in the presence of 2% glucose until a constant density of 16 × 107 cells ml−1 (24 h); no glycogen was detected in the mutant, while the content in the wild-type was 137 ± 15 mg (g dry weight)−1. The UDP-sugar concentration in both, mutant and wild-type, was similar and around 30% lower than the corresponding value determined in the W303 strain grown to stationary phase in 2% glucose (see Table 3).
Nutrient starvation was performed as described in Section 2 and the viability determined. The half-survival life time found for both mutant and wild-type, was around nine and eight days, respectively (mean of eight determinations). The absence of glycogen in the mutant did not decrease cell viability.
4 Discussion
We have been recently engaged in the study of the response of S. cerevisiae to oxidative stress, paying special attention to the metabolism of nucleotides. Concentrations of 1.5 mM H2O2 decreased, or not, the level of ATP in yeast cells growing in 2% or 0.025% glucose, respectively. However the effect of H2O2 on GAPDH was deleterious at both glucose concentrations. Following several approaches we reached the conclusion that the different effect of H2O2 on these two related parameters (ATP and GAPDH) was due to the distinct metabolic situations of yeast growing in 2% glucose (glycolytic) or in 0.025% glucose (respiratory).
The different response of yeast cells to the same oxidative stress [21,22], depending on the glucose concentration in the medium, moved us to explore whether different glucose concentrations could also influence the aging process of yeast cells during nutrient starvation in distilled water. The survival rate and the nucleotide content of yeast cells grown in four different conditions (Exp 2%, Exp 0.1%, Sta 2% and Sta 0.1%) were determined following incubation in distilled water. Yeast cells that were grown exponentially in 2% or 0.1% glucose behaved similarly in relation to both their rate of survival and nucleotide content: (i) they survived five days in distilled water, followed by a linear decay of survival, with a half-life of around eight days in the case of the cells grown in 2% glucose, and of seven days in the case of cells grown in 0.1% glucose (Fig. 1(a) and (b); (ii) ATP and other NTPs showed a similar decay along the time of incubation in distilled water; (iii) during the first days of incubation in water, the level of NAD+ remained almost unaltered, thus stressing the importance of this metabolite (or others derived from it) in the survival in water.
When starvation in water was carried out with yeast cells previously grown up to stationary phase, the behavior of the yeast cells was dependent on the glucose concentration in the medium: (i) yeast cells grown in 2% glucose had a 100% survival of around 14 days and a half-life of 28 days as compared with the five to six days of survival and a half-life of nine days of the cells grown in 0.1% glucose; (ii) the concentration of ATP was significantly lower in Sta 0.1% than in Sta 2% cells, which may correspond to an exhaustion of the carbon source for the Sta 0.1% cells during the time of growing, before incubation in water.
From the above experiments it was calculated that yeast cells with a content of ATP, ΣA, NAD+ and adenylic charge value as low as 0.04 ± 0.01 mM, 0.37 ± 0.08 mM, 0.38 ± 0.09 mM and 0.25 ± 0.03, respectively, were still 100% viable.
Referring to the level of NAD+ and ATP several points should be stressed. The metabolic stability of NAD+, differed from that of ATP: whereas the level of ATP was higher in Sta 2% than in Sta 0.1% cells, that of NAD+ tended to be higher in Sta 0.1%; also, during four days incubation in distilled water, the concentration of NAD+ decreased to less than half, whereas the level of ATP decreased about 90%. This is well reflected by the ratio NAD+/ATP that increased about 10-fold during that period of starvation in water. Although a direct cause-effect relationship between NAD+ concentration and cell survival cannot be established at the moment, some kind of connection may exist between these two parameters. A wide array of unexpected signaling pathways for NAD+ has been recently unraveled (see [35] for a review).
Concerning UDP-N-acetylglucosamine, it was for us rather unexpected to observe a 5-fold increase in the peak corresponding to UDP-sugar(s) when growing cells up to stationary phase in the presence of 2% glucose. Analyzing the nature of the compound(s) under that peak we concluded that, in stationary phase, around 80% of it corresponded to UDP-GlcNAc and the rest to UDP-glucose. We did not detect the occurrence of GDP-sugars in our HPLC our assay conditions. As shown above, the nature of the UDP-GlcNAc was assessed by several chromatographic approaches and by MALDI-TOF analysis. UDP-GlcNAc as substrate for the synthesis of chitin in S. cerevisiae is well documented [36]. More recently, a several-fold increase of UDP-GlcNAc in yeast cells grown in the presence of glucosamine has been reported [37].
The results presented in Fig. 4 show how UDP-sugars (UDP-glucose + UDP-GlcNAc) accumulated almost in parallel with the increase at A600 when yeast cells were grown in the presence of 2% glucose. The concentration of total UDP-sugars increased from 0.32 to 1.5 mM, while the concentration of UDP-glucose in that mixture increased from 0.19 ± 0.02 mM to only 0.39 ± 0.04 mM. The level of UTP (0.31 ± 0.04 mM) remained almost constant during that period of growth (not shown). From these data, it could be calculated that the concentration of UDP-GlcNAc, in the exponential phase of growth, represented less than 40% of the UDP-sugar pool, in comparison with a value of 80% determined in the cells grown to stationary phase. As far as we are aware, the present report describes for the first time the big increase (7-fold) of UDP-GlcNAc in Sta 2% cells, with respect to other growth conditions (Sta 0.1%, Exp 2% or Exp 0.1%).
As it is apparent from the results collected in Fig. 4, both the concentration of glycogen and UDP-sugars are higher in stationary than in exponentially growing cells. Also, upon transfer of the yeast cells to distilled water, the viability of the cells previously grown up to stationary phase is higher than those grown up only to logarithmic phase. Although a direct cause–effect relationship between cell viability and glycogen and/or UDP-N-acetylglucosamine cannot be established at present, the potential role of glycogen was analyzed with the help of a double mutant in glycogen synthase (gsy1Δgsy2Δ). The results presented here are in line with previous results obtained by others [34] where mutants unable to synthesize glycogen showed no decrease of cell viability as compared with the wild type. A similar experiment with a mutant unable to accumulated UDP-N-acetylglucosamine could not be performed since, as far as we know, mutants defective in the route of synthesis of this compound are not viable [38–41].
Although at present the physiological significance of the increase in the concentration of UDP-GlcNAc is not clear to us, some speculations could be raised. The high concentration of this compound in Sta 2% cells, in comparison to that present in Sta 0.1% cells, indicates some role for glucose as inducer of this event; the increase of UDP-GlcNAc in comparison to the steady-state concentrations of ATP or UTP could be indicative of some relationship between the concentration of the UDP-GlcNAc and cell density and/or of the preparation of the yeast cells for the synthesis of the chitin necessary to complete the cycle of budding [36].
Acknowledgements
This investigation was supported by grants from Dirección General de Investigación Científica y Técnica (BMC 2002–00866), the Comunidad de Madrid (08/0021.1/2001) and the Instituto de Salud Carlos III, RCMN (C03/08), Madrid. We acknowledge the performance of the MALDI-TOF analysis to Ma Teresa Alonso and Ma Jesús Vicente from the Servicio Interdepartamental de Investigación (UAM). We thank Ana Rita Tavares and Luisa Ferreira Alvares, Erasmus students (University of Porto) and Cristina Almansa, for their help in some of the experiments here described, Anabel de Diego for technical assistance, and Dr. Claudio F. Heredia for critical reading of the manuscript. The double mutant in glycogen synthase was kindly supplied by Dr. Jean François. H.O. was supported by a Fellowship from Fundação para a Ciência e a Tecnologia e do Fundo Social Europeu no âmbito do III Quadro Comunitário de Apoio, Portugal(SFRH/BD/1477/2000). C.A. was supported by a Fellowship from Dirección General de Universidades e Investigación.
References
Author notes
These authors contributed equally to this work.
